Summary
Fertility desires within a couple reflect characteristics of both partners. This project predicts them from dyadic survey data on 515 premarital couples using random forest models, and then examines which variables drive the predictions. Because partners share relationship-level information, cross-validation is grouped by couple so that both members of a pair fall in the same fold, and every data-dependent step — oversampling, encoding, threshold selection, and the Shapley explainer — is fit within the training fold. Shapley additive explanation values computed on held-out cases quantify how much each variable contributed to the predictions, and a couple-level cluster bootstrap examines whether adding partner-reported predictors improves prediction beyond a person's own characteristics.
Background
Whether to have children is not an individually held preference; it is negotiated between two people, and in this sample the two members of a couple agreed on the dichotomized outcome in 89.7% of couples. That observation shapes both the substantive question and the analytic design.
The substantive question concerns incremental validity: how much does knowing about someone's partner add beyond knowing about the person? Additive regression models for dyadic data estimate actor and partner coefficients, but they address a somewhat different question — the unique linear contribution of each term with the others held fixed — and they assume in advance that influences combine additively.
The dyadic structure also has a methodological consequence. Because partners share relationship-level information, cross-validation that splits individuals can leak: if one member of a couple is in the training fold and the other in the test fold, the held-out person's outcome may be partly recoverable from their partner's record, and estimated performance would be optimistic. The couple therefore has to be the unit of resampling.
Methods
Data and design
The analytic sample comprises 515 Korean premarital couples, or 1,030 individuals, with both partners passing data-quality screening. The outcome is the desired number of children, dichotomized as none versus one or more; the minority class is 18.2%, so the no-information rate is .818 and accuracy is not an informative selection metric. Predictors comprise 85 measures per partner spanning demographics and socioeconomic status, housing, family of origin, relationship history and quality, personality and attachment, gender-role and divorce attitudes, and financial habits. Three design matrices were constructed: actor-only (86 predictors), actor plus partner (166), and partner-only (80).
Missing data were handled by variable-level rather than case-level screening. Missingness was tabulated across candidate predictors and two patterns distinguished — ordinary item nonresponse and structural missingness arising from conditionally administered items — and only predictors with complete data were retained, so no participants were dropped. A partner pair was kept only where both members were complete, which keeps the two design matrices structurally identical. The couple-wide file was then reshaped into the standard pairwise double-entry layout, with each person appearing once as actor and their partner's variables attached as a partner block.
Resampling and leakage controls
- Couple-grouped, stratified cross-validation Ten folds grouped by couple, so both partners always fall in the same fold, and stratified on the outcome given the small minority class. Fold assignments are identical across models, so comparisons are paired.
- Outcome and shared variables removed The partner's own outcome is excluded, as is a set of variables whose within-couple responses are near identical (relationship length, r = .998; living arrangement, r = .87, and three others), since retaining both copies would divide one signal across two columns.
- Training-fold fitting Oversampling, scaling, decision-threshold selection, and Shapley explanation are all fit on training data only, with category levels pinned before splitting so that every fold produces an identically ordered design matrix.
- Pooled out-of-fold metrics Performance is computed on pooled predictions for all 1,030 individuals, each from a model that did not see them.
Models and interpretation
Four pipelines were run on each of the three predictor sets: random forest with decision-threshold adjustment; random forest with SMOTENC oversampling; balanced random forest with class-balanced bootstrapping; and an L2-regularized logistic regression baseline. Oversampling was applied to the raw, pre-encoding training fold so that categorical values are synthesized within categories rather than interpolated across dummy variables. No hyperparameter search was conducted; forests were grown with 1,000 trees and library defaults, which avoids a nested cross-validation requirement and any associated selection bias in the out-of-sample estimate. The only tuned quantity is the decision threshold, selected within each training fold from the forest's out-of-bag decision function. Model comparison uses a couple-level cluster bootstrap (2,000 resamples of couples) giving the observed ΔAUC with a percentile interval.
For interpretation, a tree explainer is fit per fold on that fold's model and applied to that fold's held-out cases, giving out-of-fold attributions that describe data the model did not train on. Contributions of dummy columns are summed back to their parent variable, separately for actor and partner versions, so that variables with many levels are not diluted across columns.
Results
The best-performing model — random forest with SMOTENC, actor predictors only — reached AUC = .929 on pooled out-of-fold predictions, compared with .811 for the regularized logistic baseline. The forests recovered 71–72% of the minority class at 92–95% precision, while the linear baseline recovered under half of it despite an accuracy of .834.
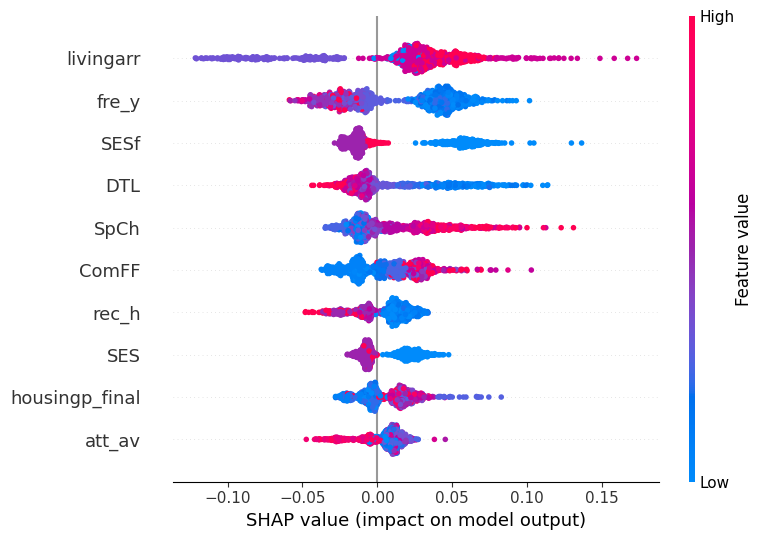
livingarr) and relationship length
(DTL) rank highest; axis labels are the study's internal variable codes.Adding 80 partner predictors changed AUC by −.0045, 95% CI [−.0124, .0032], p = .26, and the direction was consistent across all four pipelines. Several observations suggest this reflects redundancy rather than irrelevance: the partner block alone, containing no actor information, reached AUC = .927; seven of the ten most influential partner-only predictors are partner counterparts of actor-only top-ten variables; and within-couple correlations among the leading predictors average r ≈ .55–.58, with couples agreeing on the outcome 89.7% of the time.
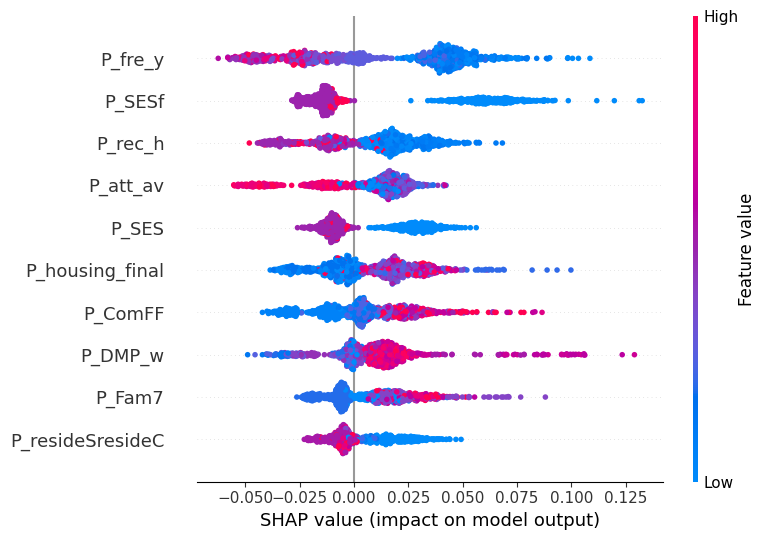
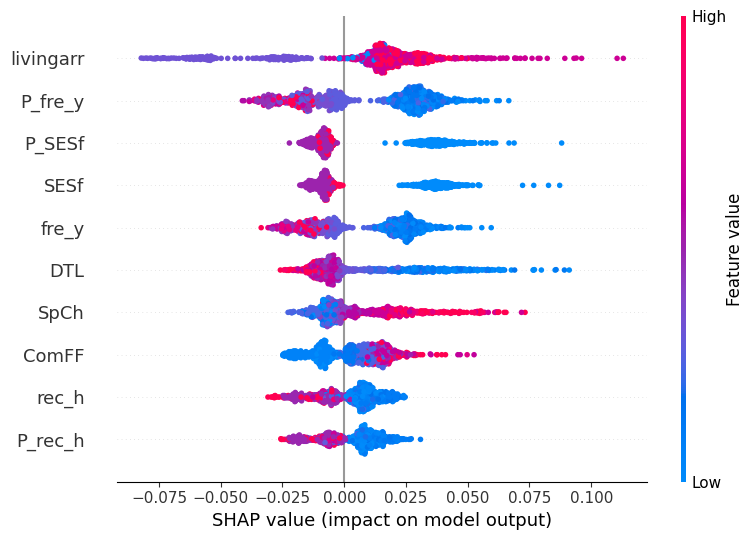
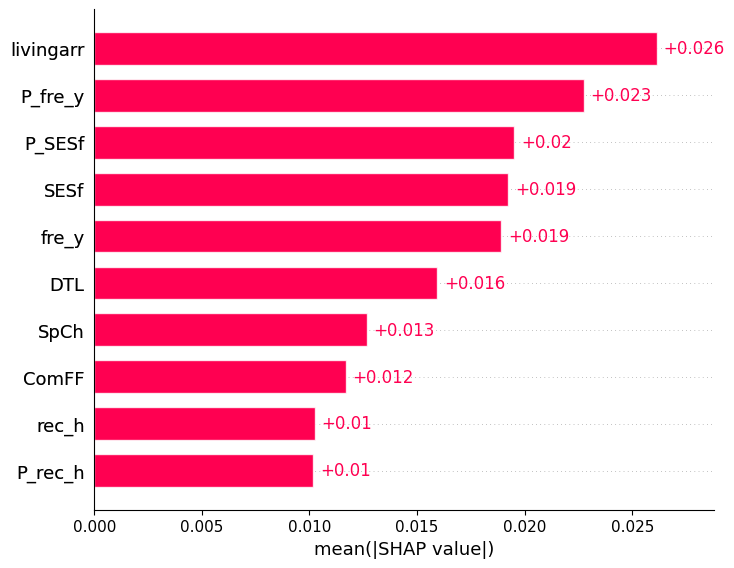
Taken together, these results suggest that a couple's fertility desires may be better described as a property shared across the dyad than as two separately determined individual preferences that happen to correlate.