Abstract
Behavioral addiction is characterized by a persistent preference for immediate rewards over long-term outcomes, reflecting a breakdown in value-based decision-making. To elucidate the mechanism underlying this maladaptive pattern, researchers have applied reinforcement learning (RL) models to the Iowa Gambling Task (IGT). However, two limitations remain. First, parameter recovery has received limited scrutiny, raising concerns about the reliability of individual-level estimates. Second, these models rely solely on choice data and ignore other informative modalities such as response times (RTs), although RTs can be collected easily and provide distinct information from choice. To address these limitations, we integrated an RL model for the IGT with an evidence-accumulation structure of sequential sampling models (SSMs), resulting in a joint model of IGT choices and RTs. The RL component updates subjective deck values based on trial-by-trial feedback, and the SSM component links these values to within-trial decision dynamics. We validate the proposed model with two approaches. First, a simulation study shows that all seven individual-level parameters are recovered accurately. Second, absolute model fits to IGT data from 20 older adults demonstrate that the model reproduces card-wise choice trajectories, win-stay/lose-shift patterns, and empirical RT distributions. The results also show the joint model performs as well as or better than several choice-only RL models for the IGT, in both simulation and empirical application. Overall, our modeling approach provides a unified account of choice and RT in the IGT while yielding reliable individual-level estimates for investigating value-based decision-making processes.
Background
Behavioral addiction is marked by persistent pursuit of immediate reward despite mounting long-term cost, a pattern often described as a breakdown in value-based decision-making. The Iowa Gambling Task (IGT; Bechara et al., 1994) is a standard laboratory assay for this pattern, and a family of reinforcement learning models has developed around it: PVL-Delta (Ahn et al., 2008), VPP (Worthy et al., 2013), the Outcome-Representation Learning model (ORL; Haines et al., 2018), and VSE (Ligneul et al., 2019).
Two considerations motivated this project. First, these models are routinely used to make claims about individuals, but parameter recovery — whether a model can retrieve known values from data it generated itself — has received limited attention. PVL-Delta and VPP were introduced without recovery analyses; ORL reported recovery as a distribution of correlations, with two parameters recovering less well; and VSE reported regression lines rather than per-individual scatter, so individual-level recoverability is difficult to assess.
Second, choice-only models set aside response time. Competing models often fit the same choice patterns, so choice alone provides limited leverage for distinguishing between theoretical accounts, and it under-constrains estimation. ORL illustrates this: its expected value, expected frequency, and perseveration components can offset one another, so choices alone do not identify which mechanism produced a given deck preference. Response time is inexpensive to collect, continuous, and right-skewed, and joint choice–RT modeling is well established elsewhere in mathematical psychology and psychometrics. Applying the RL–SSM framework to the IGT combines learning across trials with evidence accumulation within a trial, and the additional constraints response time provides may improve identifiability.
Methods
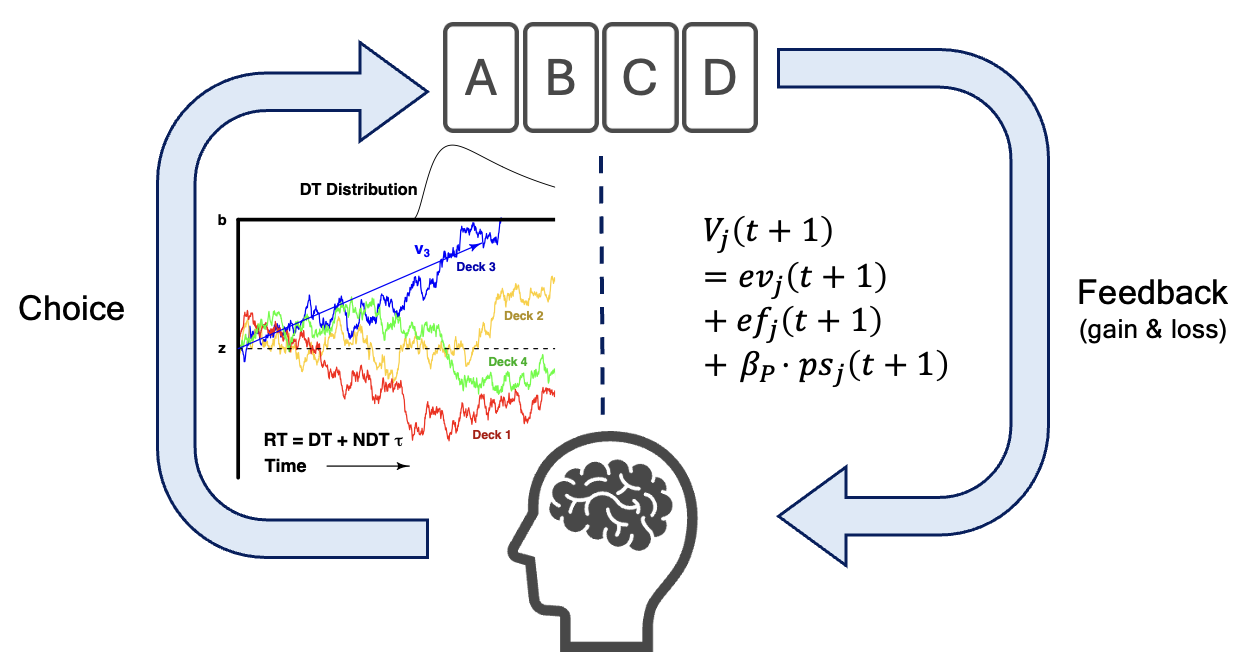
V_j = ev + ef + βP·ps;
these values scale the drift rates of four racing diffusion accumulators, and the first to
reach threshold b determines the choice, with response time given by the
decision time plus non-decision time τ.Task and data
The task was a computerized IGT of 100 trials with four decks, following the standard payoff structure in which two decks give larger immediate gains but are disadvantageous over time, and loss frequency is crossed with loss magnitude. Data come from 20 older adults (19 female; ages 67–87, mean 77) recruited through local senior centers as part of a larger project on late-life social isolation and addiction vulnerability.
Behavioral data were collected within a concurrent fNIRS study requiring a fixed six-second trial, so response time is defined as the interval from the previous trial's feedback onset to the current card selection — the time taken to update value representations and select. Trials without a response (about 0.6%) were excluded; because no feedback followed them, no learning occurred, so their exclusion is consistent with the model. Choice trajectories were compared against the ten healthy-adult IGT datasets compiled by Steingroever et al. (2015) and were broadly consistent with them.
Reinforcement learning component
The learning model builds on ORL, in which deck utility is the sum of expected value, expected frequency, and perseveration. The modification concerns how learning rates are separated: where ORL separates them by outcome valence, this model separates them by the kind of information being updated, with one rate for expected value and one for expected frequency, each component updating independently on every trial.
- Expected value A delta rule,
ev_j(t+1) = ev_j(t) + A_ev · [x(t) − ev_j(t)], withA_ev ∈ (0,1)governing sensitivity to prediction error. - Expected frequency Sign-based learning, motivated by the
win-frequency effect. The chosen deck updates toward
sgn(x(t))and each unchosen deck toward−sgn(x(t))/3, so the model represents relative win frequency across alternatives rather than treating decks in isolation. - Perseveration Decays geometrically with
K = 3^(K′) − 1,K′ ∈ (0,5), following the reparameterization reported as optimal by Haines et al. (2018). The weightβPis estimated unconstrained, so its sign distinguishes perseveration from alternation rather than assuming one of them.
Sequential sampling component and linking function
The evidence-accumulation stage is a racing diffusion model: one independent accumulator per
deck, with the first to reach threshold determining the choice and its first-passage time
giving the decision time. A racing architecture was chosen over the binary diffusion decision
model because it extends directly to the four-alternative structure of the task while
remaining compatible with trial-by-trial value updating. Three parameters are estimated at
this stage: the threshold b, non-decision time τ, and a drift
scaling v_s mapping the learned-value scale onto the drift-rate scale.
Values enter the accumulation process through a linear link,
v_j(t) = v_s · [V_j(t) − V_k(t)], where V_k is the
minimum subjective value on that trial, which keeps drift rates non-negative. Higher learned
value therefore implies faster accumulation, and so both a higher choice probability and a
shorter response time, in place of the conventional softmax rule. A nonlinear link, a decaying
decision boundary, and perseveration expressed as a boundary adjustment were also implemented;
none improved recovery or fit, so the linear link was retained.
Estimation
- Framework Bayesian, with seven parameters estimated per
participant: four reinforcement learning (
A_ev,A_ef,K′,βP) and three sequential sampling (b,τ_rel,v_s). - Likelihood The joint density of choice and response time was derived and implemented directly, rather than fitting the two channels separately.
- Sampler Hamiltonian Monte Carlo (NUTS) in Stan; three chains × 2,000 iterations with 1,000 warm-up, giving 3,000 post-warm-up draws.
- Reparameterization Non-decision time is estimated as a
relative quantity
τ_rel ∈ (0,1)and transformed asτ = min(RT) × τ_rel, so the constraint0 < τ < min(RT)holds by construction. - Priors and convergence Weakly informative priors throughout;
convergence assessed by Gelman–Rubin
R̂ < 1.1for every parameter of every participant, together with trace-plot inspection.
Validation
Validation rests on absolute fit and on recovery rather than on an information criterion, since a relative ranking would not indicate whether any of the candidate models describes the data or whether their parameters are identifiable.
- Posterior predictive checking Parameter sets drawn from across the posterior are used to re-run the experiment generatively: the simulated participant begins with initial values, chooses, receives feedback from the payoff scheme, updates, and iterates through all 100 trials. Three criteria are examined — card-wise choice trajectories, win-stay/lose-shift transitions, and response time distributions at the .1/.3/.5/.7/.9 quantiles, evaluated subject-wise, card-wise, and action-wise.
- Parameter recovery Individual posterior means from the empirical fit served as generating values, so the synthetic data lie in a psychologically plausible region of parameter space; 20 synthetic participants × 100 trials were simulated and the model refit with an identical procedure. Recovery is reported as per-individual scatter against the identity line with ±1 SD posterior error bars, and summarized by Spearman rank correlation.
- Benchmarks ORL and PVL-Delta were fit to the same data and put through the same posterior predictive checks and recovery pipeline.
Results
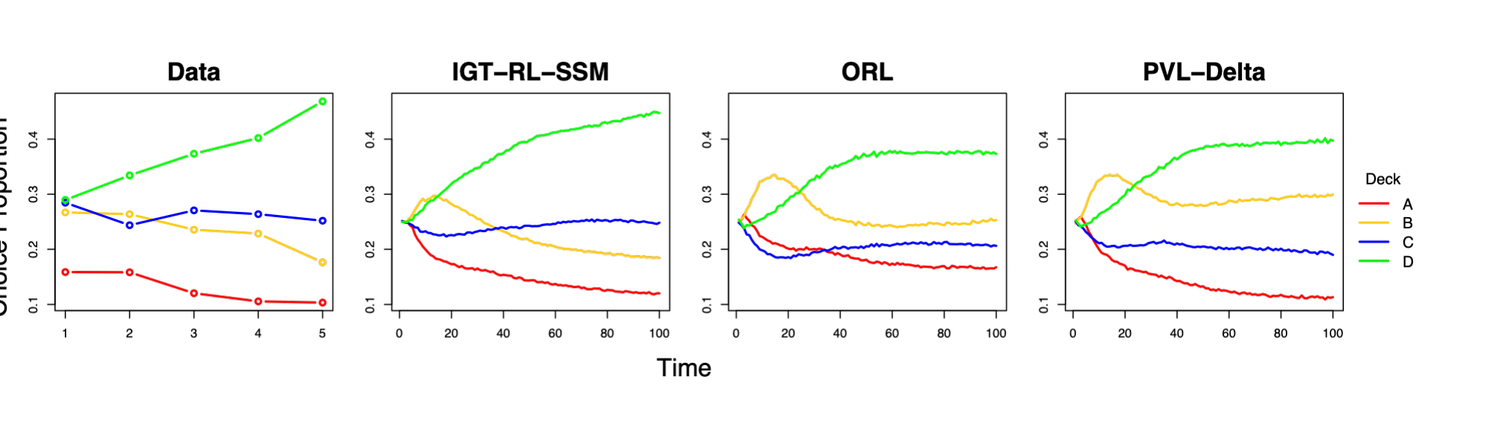
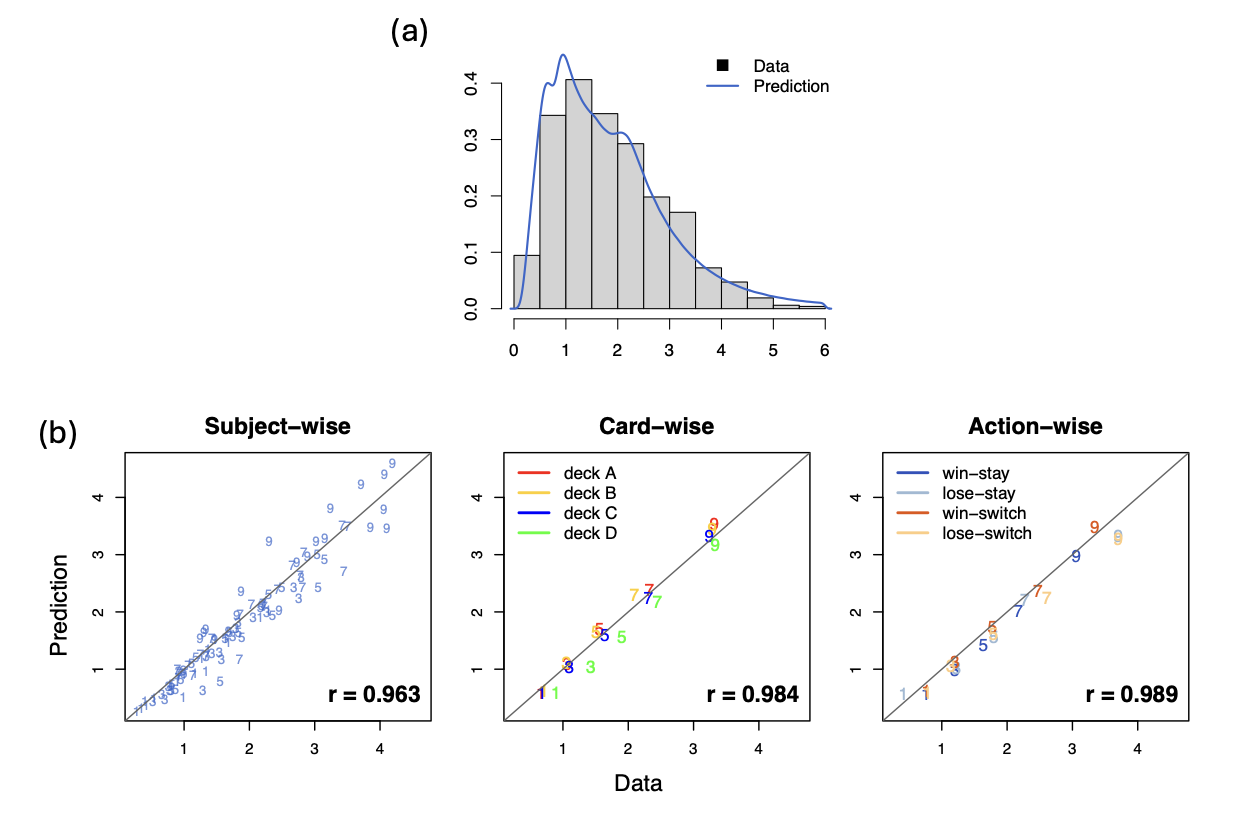
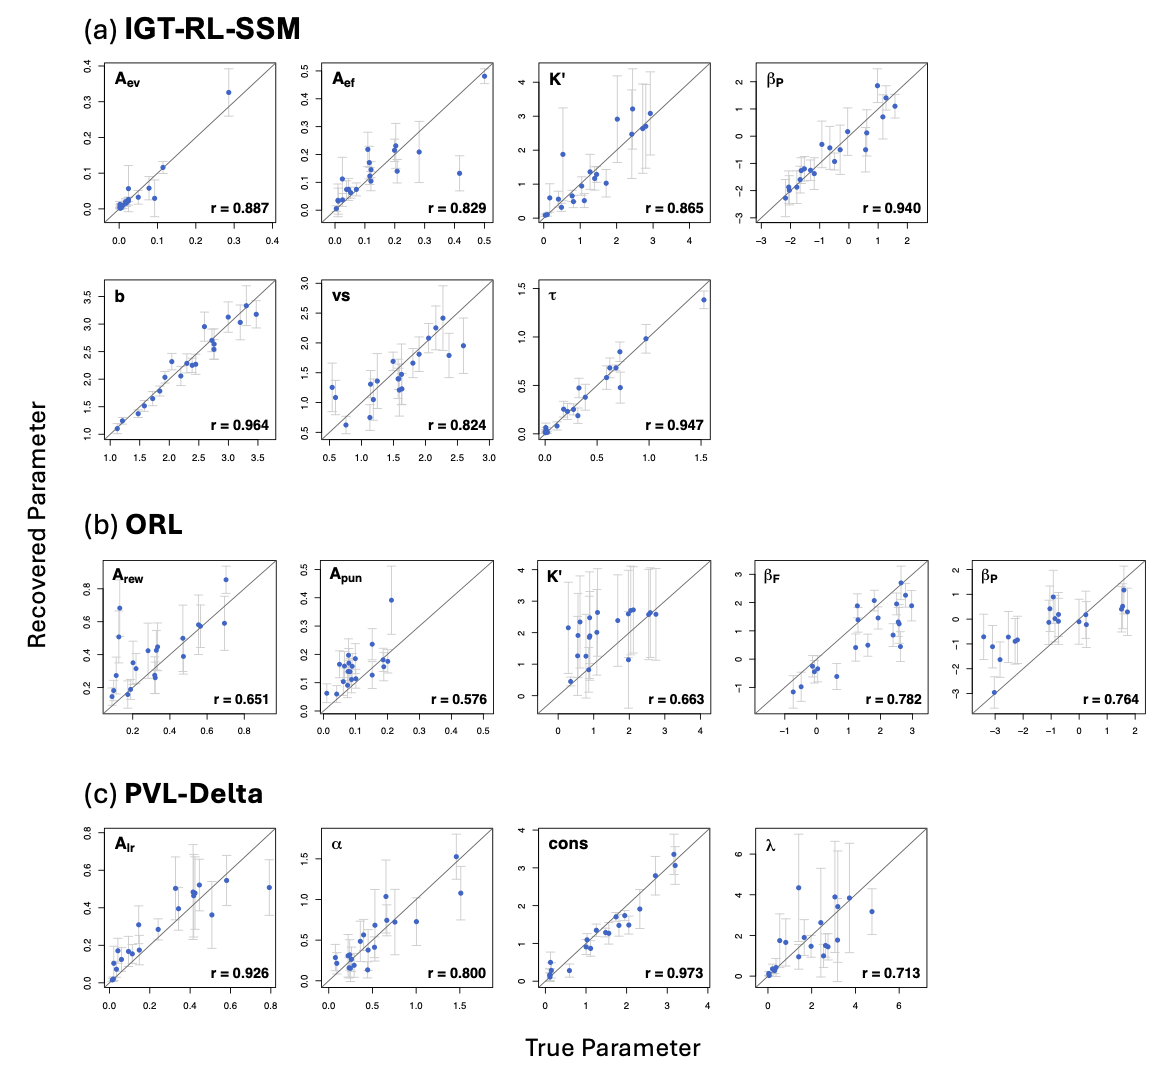
Across the three criteria, the joint model reproduced the empirical ordering of deck preferences, accounted for the response time distribution, and recovered its individual-level parameters accurately in simulation. Its weakest-recovering parameter is comparable to the weakest reported for published joint choice–RT models (r = .78 and .74 in Miletić et al., 2021; a lowest r = .78 across eight parameters in McDougle & Collins, 2021).
Limitations and next steps
Empirical validation rests on a small and demographically narrow sample of 20 older adults, so larger, more diverse, and clinical samples would be a natural next test. The value-to-drift link is linear; nonlinear links have been proposed to address choice-accuracy misfits, although the nonlinear variant examined here recovered less well. Only the drift rate is made learning-dependent, since boundary and starting-point dynamics were explored and did not improve recovery. The concurrently collected fNIRS data also allow the model to be extended towards model-based cognitive neuroscience, using the factor-analytic linking function described in the joint modeling project.